Edge Impulse Uploader
Captures and uploades data to the Edge Impulse Injest service
Toolbox

Breadboard Footprint
N-A
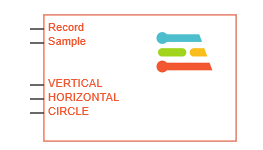
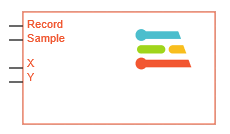
Schematic Symbol

Description
Edge Impulse is the leading development platform for machine learning on edge devices. Their portal allows you to train machine learning models and deploy those models on stand alone embedded devices.
The Virtual Breadboard EdgeImpulse icon can be used to aquire data from virtual or real data sources ( via EDGEY interface) and upload to a specific EdgeImpulse project via their Injest Service.
On the Record pin a rising-edge high data capture starts. Every rising-edge on the Sample pin records a sample from all Axis pins is recorded with the Interval timestep. If Sample pins is not wired then every simulated Interval milliseconds a sample is recorded from all Axis pins. On the falling-edge of the Record pin the recorded data will be submitted using theHMAC and API KEY to either the training, testing or anomoloy service specified by the Injest property. The data is submitted using the active Data Label pin.
Pin Out
| Property | Default | Description |
|---|---|---|
| Record | - | rising-edge starts recording. falling-edge submits data |
| Sample | - | A comma seperated list of Axis |
| Axis | - | Axis pins are dynamically created to collect sample data |
| Data Labels | - | Data label pins are dynamically created to markup submitted sample data sets |
Properties
| Property | Default | Description |
|---|---|---|
| Data Labels | - | A comma seperated list of Labels |
| Axis | - | A comma seperated list of Axis |
| Units | - | A comma seperated list of Units |
| Interval(ms) | 100 | An integer number milliseconds between axis samples |
| API KEY | - | The API Key of the Edge Impulse project to submit data to |
| HMAC KEY | - | The HMAC Key of the Edge Impulse project to submit data to |
| Submissions | 1 | The number of times a data set is submitted |
| Ingest | training | The ingest service training | training | testing | anomoly |
Data Labels
A data label marks a collection of data as representing a certain type of event or feature. Each data set has a label when submitted. When attaching labels a pin for each label is dynamically generated. To submit data for a specific label the pin should be active HIGH during the sampling period.
Example: Data Labels : VERTICAL,HORIZONTAL,CIRCLE
Axis
An axis is a data source which is a sampled as a voltage nominally between 0 and 1. When attaching axis’ a pin for each Axis is dynamically generated. The pin should be wired to a VBB data source. When a sample is taken data is captured from the VBB data source.
Example: Axis : X,Y
Units
A unit marks up an axis with a specific unit describing what the data represents
| Unit | Description |
|---|---|
| m | meter |
| kg | kilogram |
| g | gram* |
| s | second |
| A | ampere |
| K | kelvin |
| cd | candela |
| mol | mole |
| Hz | hertz |
| rad | radian |
| sr | steradian |
| N | newton |
| Pa | pascal |
| J | joule |
| W | watt |
| C | coulomb |
| V | volt |
| F | farad |
| Ohm | ohm |
| S | siemens |
| Wb | weber |
| T | tesla |
| H | henry |
| Cel | degrees |
| lm | lumen |
| lx | lux |
| Bq | becquerel |
| Gy | gray |
| Sv | sievert |
| kat | katal |
| m2 | square |
| m3 | cubic |
| l | liter(volume)* |
| m/s | meter per second(velocity) |
| m/s2 | meter per square second(acceleration) |
| m3/s | cubic meter per second(flow rate) |
| l/s | liter per second(flow rate)* |
| W/m2 | watt per square meter(irradiance) |
| cd/m2 | candela per square meter(luminance) |
| bit | bit(information content) |
| bit/s | bit per second(data rate) |
| lat | degrees latitude |
| lon | degrees longitude |
| pH | pH value(acidity; logarithmic quantity) |
| dB | decibel(logarithmic quantity) |
| dBW | decibel relative to 1 W(power level) |
| Bspl | bel(sound pressure level; logarithmic quantity)* |
| count | 1 (counter value) |
| / | 1 (ratio e.g., value of a switch;]) |
| % | 1 (ratio e.g., value of a switch;]) |
| %RH | Percentage(Relative Humidity) |
| %EL | Percentage(remaining battery energy level) |
| EL | seconds(remaining battery energy level) |
| 1/s | 1 per second(event rate) |
| 1/min | 1 per minute(event rate, 'rpm') |
| beat/min | 1 per minute(heart rate in beats per minute)* |
| beats | 1 (Cumulative number of heart beats)* |
| S/m | Siemens per meter(conductivity) |
| B | Byte(information content) |
| VA | volt-ampere(Apparent Power) |
| VAs | volt-ampere second(Apparent Energy) |
| var | volt-ampere reactive(Reactive Power) |
| vars | volt-ampere-reactive second(Reactive Energy) |
| J/m | joule per meter(Energy per distance) |
| kg/m3 | kilogram per cubic meter(mass density, mass concentration) |
| deg | degree(angle)* |
| NTU | Nephelometric Turbidity Unit] |
Interval
The interval(ms) is the number of milliseconds between samples reported in the submitted data. In synchronous mode the interval is added for each sampling event. In asynchrounous mode (Sample pin is not wired) every interval milliseconds simulated time a sample is recorded.
Note: simulated time is usually real-time but for high frequency circuits this is not always true
API Key
Each Edge Impulse project has a unique API key ei_.. which can be found in the Dashboard/Keys panel. This is required to submit the data to the correct project.
HMAC Key
Each Edge Impulse project has a unique HMAC key which can be found in the Dashboard/Keys panel. This is required to secure the submitted data.
Submissions
Edge Impulse models have a minimal data set requirement. To submit the same data multiple times select submission count more than one. Each data set is rotated by 1 on each submission so that the data sets are not all identical.
Ingest
The Edge Impulse Ingest endpoint support 3 destination locations. This is where the data set will be directed when submitted
training
testing
anomoly